Berlin Venture Atlas
Berlin's startup ecosystem is dense enough to hide its own structure. The Atlas turns 111 companies, eight sectors, five districts, and nine funding events into one interface, with the snapshot date and source coverage visible beside the data.
Role and process
Role: Frontend engineer and product designer
Challenge: The design problem was to make a dense dataset of Berlin companies, sectors, investors, and funding events legible without reducing the ecosystem to a flat list.
- Use a treemap overview to make relative sector density visible at a glance.
- Keep the ecosystem, company, investor, and capital-flow views in one interface so visitors can change lenses without losing context.
- Show the snapshot date and source coverage beside the visualization.
Snapshot: 15 July 2026 · Records sourced: 111 of 111 · Sectors: 8 · Districts: 5 · Events: 9
Tools: TypeScript, React, D3.js, Data visualization, Interactive maps
A map before a list
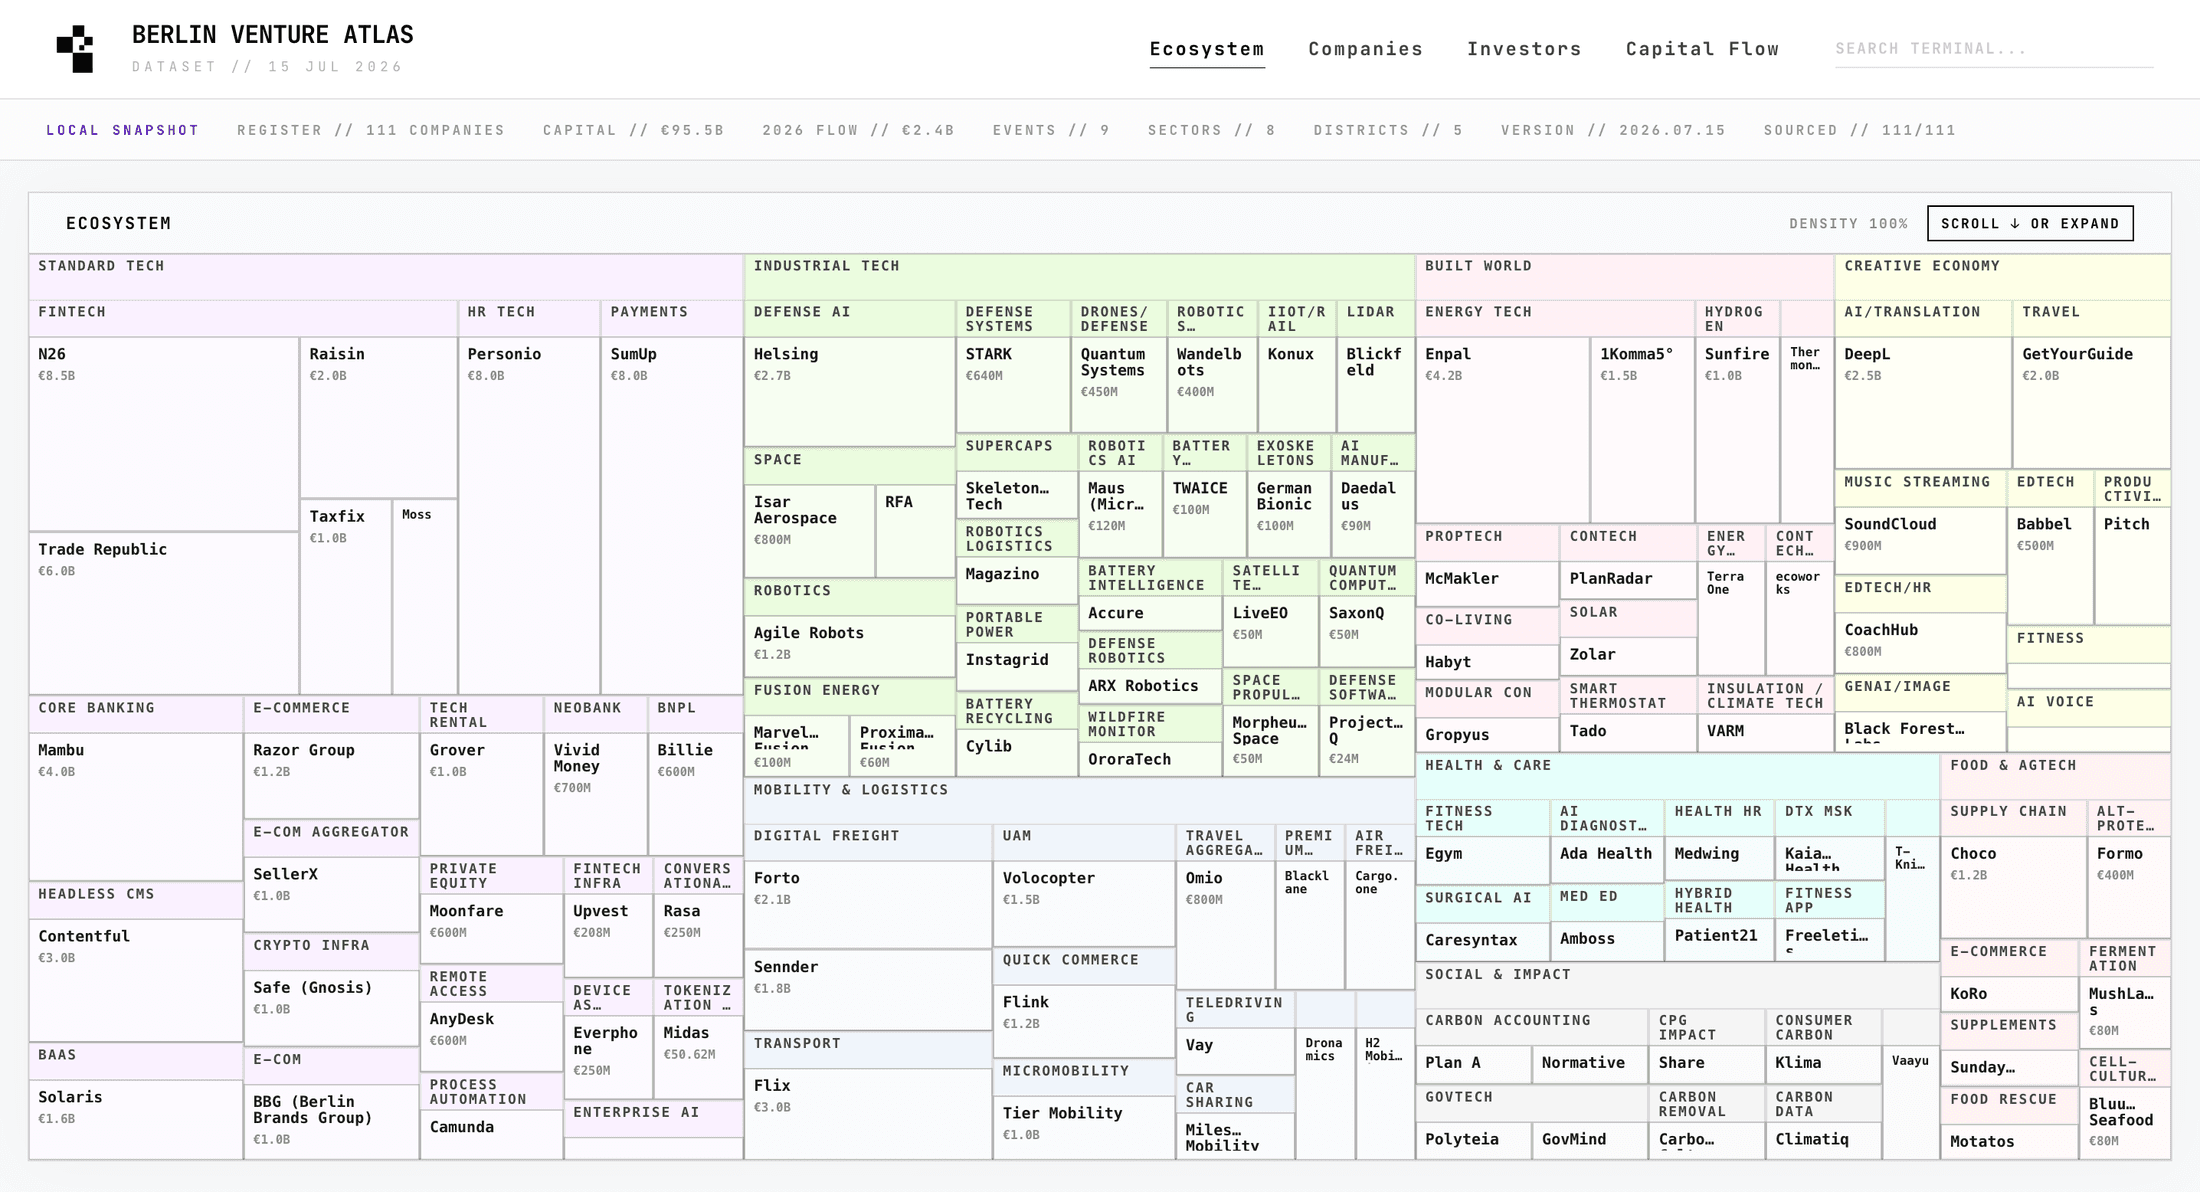
The opening view arranges companies as a treemap. Sector area shows density; company cells carry the names and valuations. Counts and the snapshot date sit above the map, so the scope is never implied.
From sector to investor
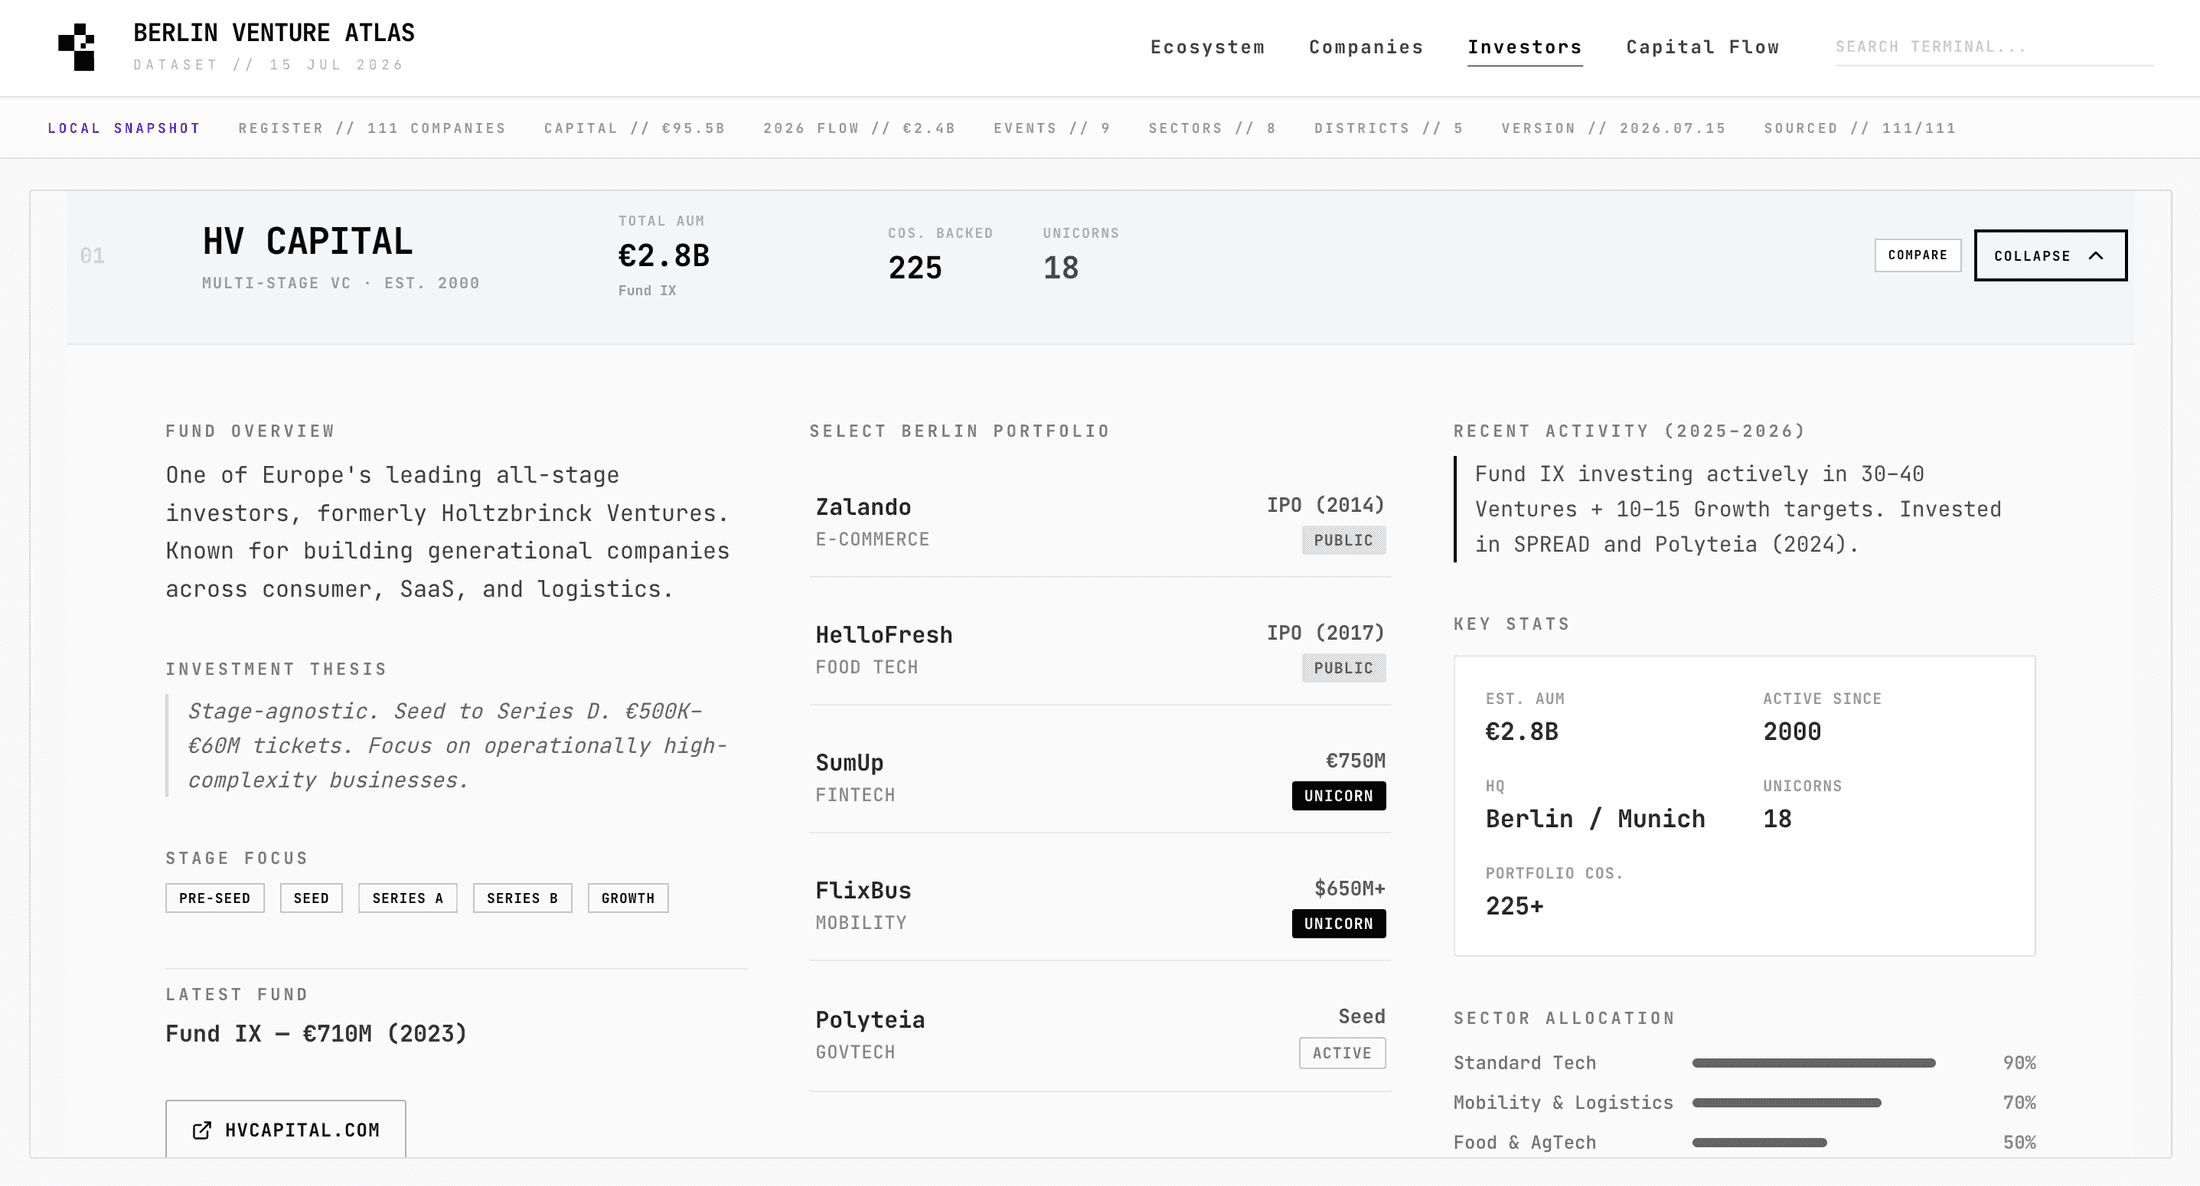
Selecting an investor opens a dossier: portfolio, recent activity, and allocation. The map and the record share one interface, so moving between lenses does not reset context.
Capital over time
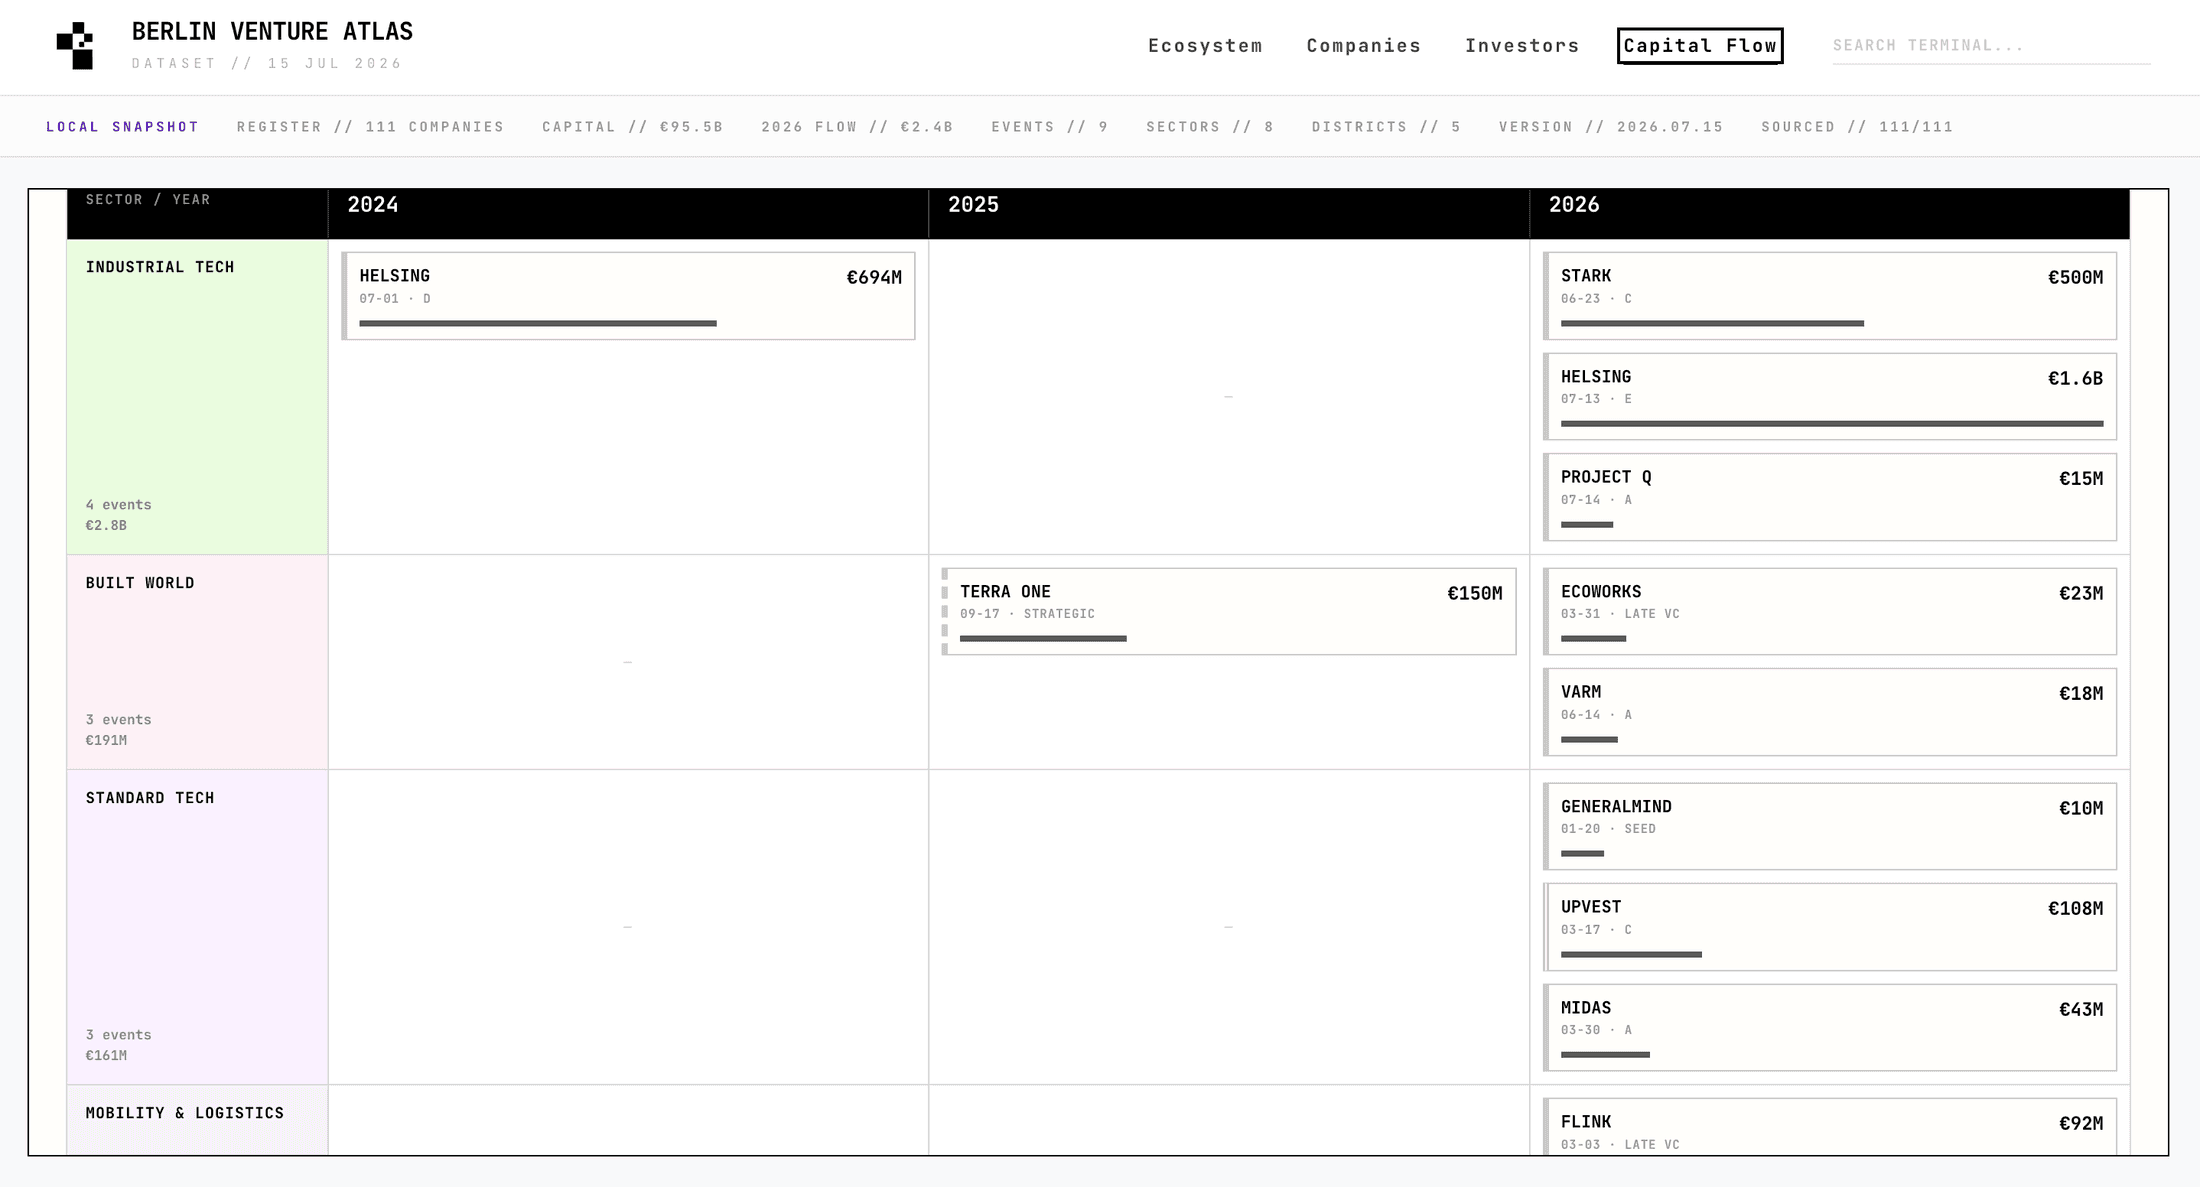
The capital-flow view compares funding by sector across years. Empty years stay visible; the shape of the market is part of the story.
A dated snapshot
The prototype uses a local snapshot rather than a live feed. Every company record is marked as sourced, and the interface reports what the snapshot covers: eight sectors, five districts, nine events. Next step: make each capital figure inspectable at the source.